Tables
PetroVR makes extensive use of tables, that is, ordered arrangements of data in rows and columns. They are used both for entering and managing inputs and for simply visualizing data belonging to a series of similar objects. This implies that tables are used whenever their capabilities may make them useful: to introduce lists of model objects, to enter data necessary for algorithms, to display results, etc.
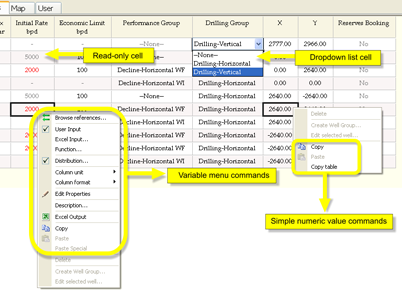
When working with table cells, it is important to keep in mind that their behavior will vary according to the kind of content they accept: variables, simple numeric values, or dropdown lists (containing model objects, Boolean values, units, etc.). Each of these is characterized by different input options and right-click menus.
- Variable cells offers by right-clicking all the features usually attached to variables: defining as a function or Excel input, adding distributions, changing units and formats, etc. Variable cells appear mainly in Model Object Tables. If a variable displayed in a table has a probability distribution or is tagged as result, this information is shown in the cell:
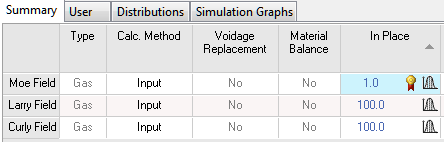
Activities and Facility Capacity tables contain variables that cannot be viewed or edited separately elsewhere, so these icons are the only indication that a distribution or a result tag exists. (See Other Tables.)
Variables defined as arrays or tables are indicated as an ellipsis (...). Double-click on the cell to view or edit the variable.
- Simple numeric value cells accept only a direct input, and offers the basic right-click options of copying and pasting.
- Dropdown list cells allow you to choose from a number of relevant options, and also offer the basic right-click commands.
- Finally, any of these may also be a read-only cell, whose input value appears grayed. In this case, only the Copy command will be available.